BLOG
>
General
Lavinius Marcu
|
10 Minutes Read
How to Make Amazing Infographics in 5 Simple Steps
Hire Graphic Designer
Find Graphic Design Jobs
Hire Social Media Marketing Specialist
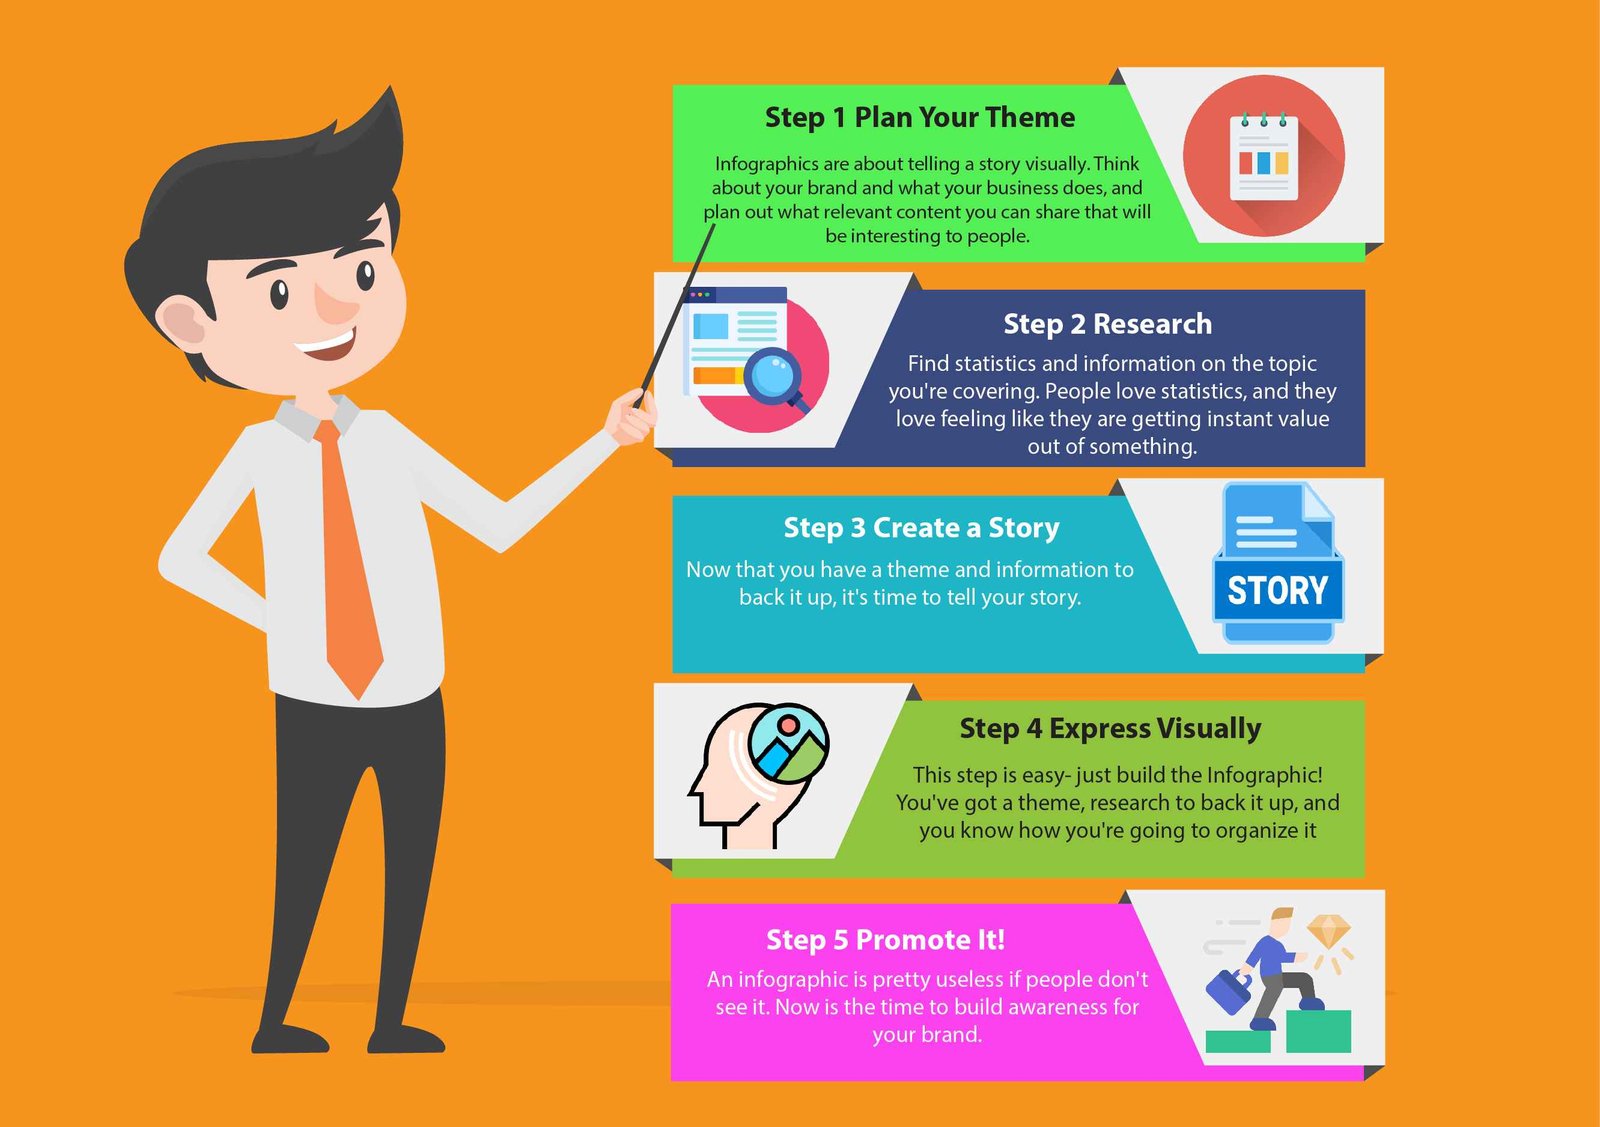
In today's world, visual content is an essential element of any successful marketing campaign. One of the most popular types of visual content is infographics. Infographics are a great way to present complex data in an easy-to-understand and visually appealing format. They are highly shareable and can be used across a variety of platforms, making them an essential tool for any business looking to improve its marketing efforts.
However, creating a visually stunning and effective infographic can seem daunting if you don't have experience in graphic design. Many businesses opt to Hire a Graphic Designer to create their infographics for them, but this can be costly. Luckily, there are ways to create amazing infographics on your own with the right tools and guidance. In this tutorial, we'll walk you through the five simple steps to create amazing infographics that will impress your audience.
Related Post: What is Graphic Design?
Step 1: Choose Your Topic and Data
The first step to creating a successful infographic is to choose a topic that is both interesting and relevant to your audience. Once you have your topic, it's time to gather the data that you will use to support your message. You can collect data from a variety of sources, including industry reports, surveys, and online databases.
Step 2: Plan Your Layout
Once you have your data, it's time to plan your infographic layout. You want your infographic to be visually appealing and easy to read, so think about how you can best present your data. You may want to use a combination of charts, graphs, and images to help illustrate your points. Be sure to also think about the color scheme and font choices that will be most effective in conveying your message. You can Find Graphic Design Jobs at Paperub.com
Step 3: Design Your Infographic
Now it's time to start designing your infographic. There are many design tools available online that can help you create stunning infographics, even if you don't have a lot of design experience. Some popular options include Canva, Piktochart, and Venngage. These tools offer a variety of templates, graphics, and fonts that you can use to create your infographic. Be sure to keep your audience in mind as you design your infographic and choose visuals that will appeal to them.
Step 4: Add Your Data
Once you have your design in place, it's time to add your data. This is where the real magic happens, as you transform your data into a visually stunning and easy-to-understand format. Be sure to use your chosen visual elements to help illustrate your data points, and use text sparingly to ensure that your infographic is easy to read and understand.
Step 5: Share Your Infographic
Once your infographic is complete, it's time to share it with the world. You can share your infographic across a variety of platforms, including social media, your website, and email. Be sure to include a call-to-action to encourage your audience to share your infographic with their networks. You can also consider hiring social media marketing specialists to help promote your infographic and get it in front of a wider audience.
In conclusion, creating amazing infographics doesn't have to be difficult or expensive. With the right tools and guidance, you can create visually stunning and effective infographics that will impress your audience and help you achieve your marketing goals. If you don't have design experience, consider using online tools to help you create your infographic, and be sure to keep your audience in mind as you design and share your infographic. By following these simple steps, you can create infographics that will help your business stand out and engage your audience. If you're interested in finding graphic design jobs or hiring a graphic designer, there are many resources available online to help you find the right person for your needs.
Trending Articles
BLOG
>
General
READ NEXT

World-class articles, delivered weekly.
Similar Developer Skills
Django Developers
Java Developers
AWS Developers
Machine Learning Engineers
Data Scrapers
Node.js Developers & Programmers
C++ Programmers & Developers
Xero Developer
C# Developers & Programmers
Browse Developers in the US
Georgia, GA Python Developers
NC Python Developers
Mississippi, MS Python Developers
Tennessee, TN Python Developers
Colorado, CO Python Developers
Alabama, AL Python Developers
Alabama, AL Python Developers
Michigan, MI Python Developers
New Jersey, NJ Python Developers
Similar Developer Jobs
Django Jobs
Web Data Scraping Jobs
Node.js Jobs
C++ Developer Jobs
API Jobs
C# Programming Jobs
TensorFlow Jobs
TensorFlow Jobs
TensorFlow Jobs
Browse Services
Data Analysis and Reporting Ser...
Web Programming & Development Se...
Website Builders & CMS Software Services
Join the Paperub® community
OR